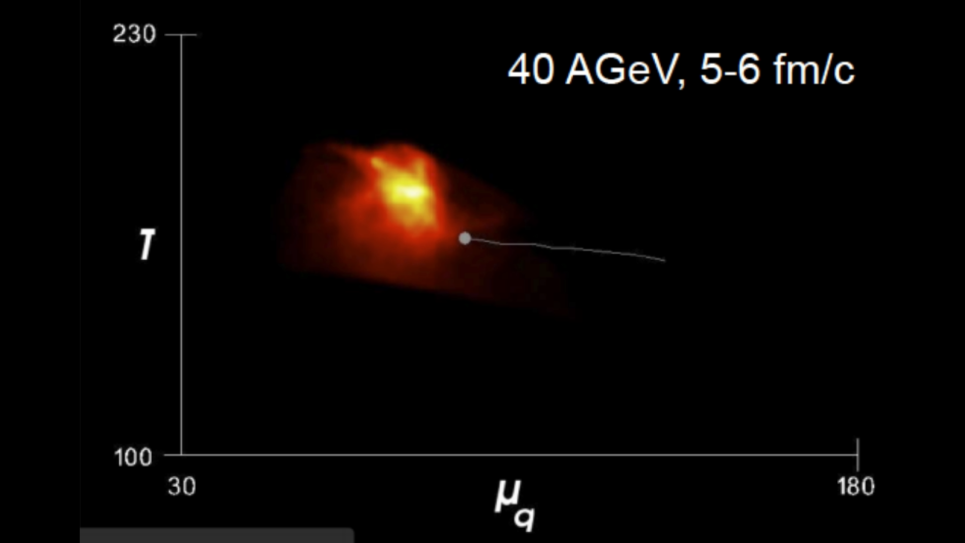
Distribution of the produced plasma on the QCD phase diagram in an event simulation. Each fluid cell is associated with a temperature and chemical potential, which is plotted here at an initial and later time. Knowledge of the EoS is essential in the complete T − µq range, with µq = 1/3µB.