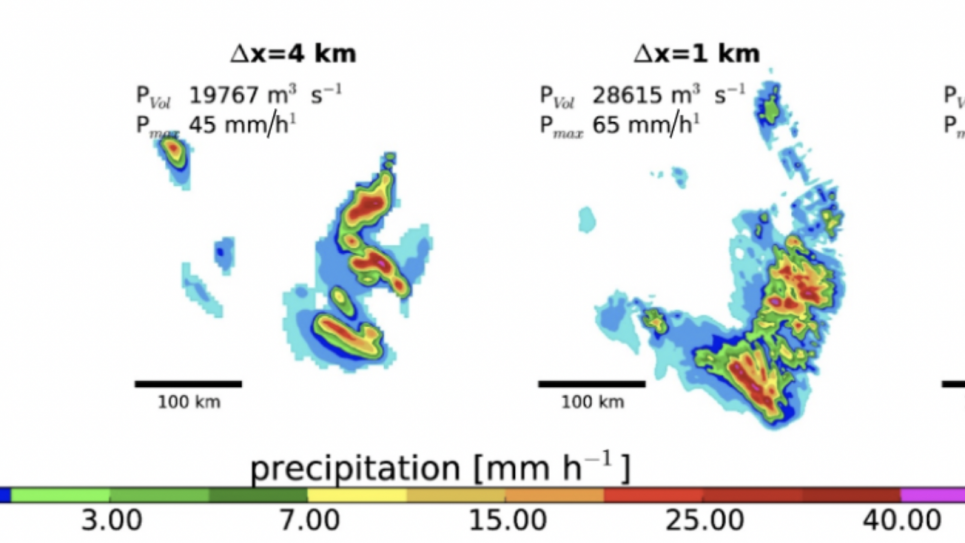
Hourly precipitation accumulation from one idealized MCS simulation in a central U.S. environment at Δx=12 km, 4 km, 1 km, and 250 m (left to right). The precipitation volume (PVol) and peak precipitation (Pmax) are shown in each panel(adapted from [16]).